Ratio Analysis and its Importance
Introduction
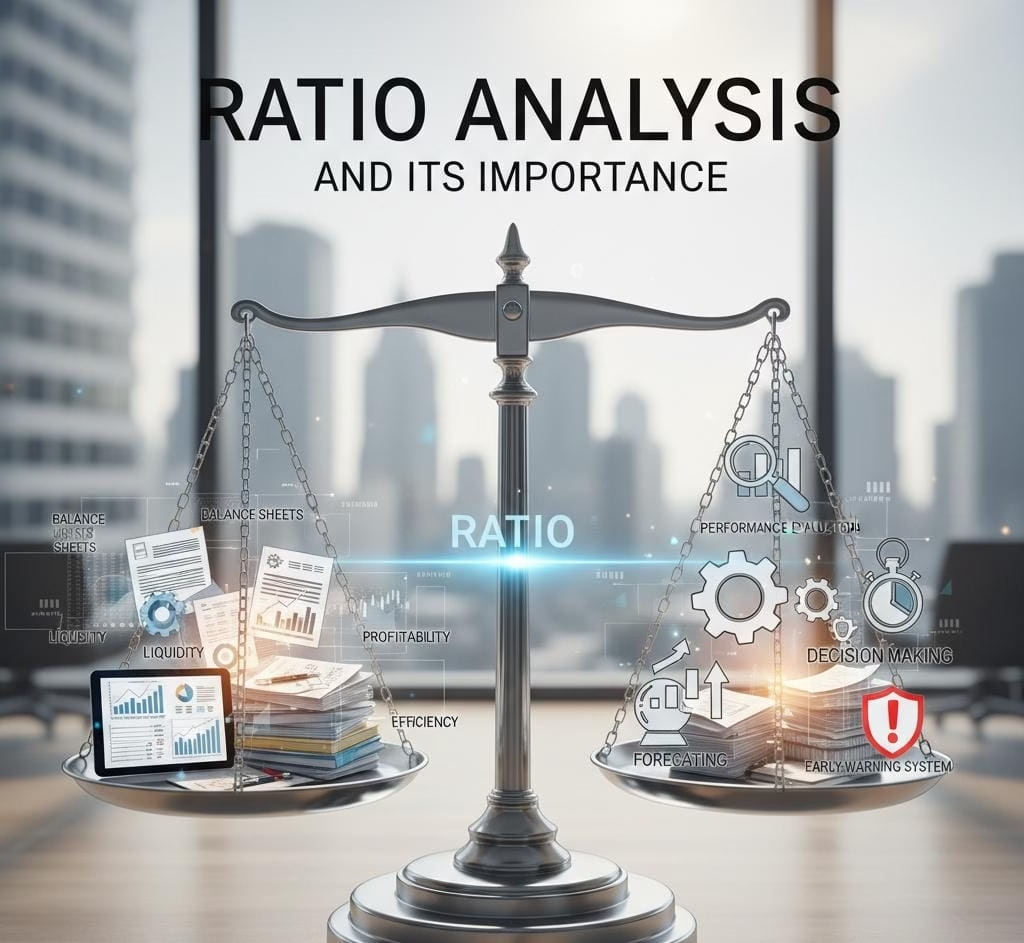
Ratio analysis is one of the most important financial tools that help businesses, investors, and analysts assess the performance and financial health of a company. By comparing different financial data points, ratio analysis provides insights into areas such as profitability, liquidity, efficiency, and solvency. This guide will explain what ratio analysis is, the types of financial ratios, and how to use them effectively.
What is Ratio Analysis?
Ratio analysis refers to the process of evaluating and interpreting financial statements through the calculation and analysis of ratios. These ratios help stakeholders (such as investors, creditors, and managers) understand a company’s financial standing and performance over a specific period. Ratios can provide insights into several key aspects, including how well a company generates profit, how efficiently it manages its assets, and its ability to meet financial obligations.
Types of Financial Ratios
Financial ratios are typically categorized into several groups. Each category offers insights into specific aspects of a company’s performance. Below are the primary types of financial ratios:
1. Liquidity Ratios
Liquidity ratios help measure a company’s ability to meet its short-term obligations. They are essential for assessing the company’s short-term financial health.
- Current Ratio
Formula: Current Assets / Current Liabilities
A current ratio of greater than 1 suggests that the company has enough assets to cover its short-term liabilities. - Quick Ratio (Acid-Test Ratio)
Formula: (Current Assets – Inventories) / Current Liabilities
This ratio is more stringent than the current ratio as it excludes inventories, which may not always be easily liquidated.
2. Profitability Ratios
Profitability ratios indicate how well a company generates profit from its resources.
- Gross Profit Margin
Formula: (Revenue – Cost of Goods Sold) / Revenue
This ratio shows the percentage of revenue that exceeds the cost of goods sold. A higher margin reflects better financial health. - Net Profit Margin
Formula: Net Profit / Revenue
It measures the percentage of revenue that remains after all expenses, taxes, and interest have been deducted. - Return on Assets (ROA)
Formula: Net Income / Total Assets
ROA indicates how efficiently a company is using its assets to generate profits. - Return on Equity (ROE)
Formula: Net Income / Shareholder’s Equity
ROE measures the profitability relative to shareholders’ equity, showing how well the company is using its equity base.
3. Leverage (Solvency) Ratios
Leverage ratios evaluate a company’s financial leverage and its ability to meet long-term obligations.
- Debt to Equity Ratio
Formula: Total Debt / Shareholders’ Equity
This ratio shows the relative proportion of debt and equity used to finance the company’s assets. A lower ratio is typically considered less risky. - Interest Coverage Ratio
Formula: EBIT / Interest Expense
This ratio measures the company’s ability to pay interest on its debt from its earnings before interest and taxes.
4. Efficiency Ratios
Efficiency ratios assess how well a company utilizes its assets and liabilities to generate sales and profits.
- Asset Turnover Ratio
Formula: Revenue / Total Assets
This ratio indicates how efficiently a company uses its assets to generate sales. - Inventory Turnover Ratio
Formula: Cost of Goods Sold / Average Inventory
This ratio shows how often a company sells and replaces its inventory in a given period. - Receivables Turnover Ratio
Formula: Net Credit Sales / Average Accounts Receivable
This ratio helps evaluate how efficiently a company collects revenue from its customers.
5. Market Ratios
Market ratios are used by investors to assess the market performance of a company.
- Earnings Per Share (EPS)
Formula: Net Income / Shares Outstanding
EPS indicates the profitability available to each share of common stock. - Price to Earnings Ratio (P/E)
Formula: Market Price Per Share / Earnings Per Share (EPS)
The P/E ratio helps determine whether a stock is overvalued or undervalued compared to its earnings. - Dividend Yield
Formula: Dividend per Share / Market Price per Share
This ratio shows the return on investment from dividends relative to the stock price.
How to Use Ratio Analysis in Business Decision Making
Ratio analysis is a powerful tool for business decision-making. Here’s how it can be applied across different contexts:
- Investment Decisions: Investors use ratios to analyze whether a company is a good investment opportunity. For example, a high ROE may indicate a good return on investment.
- Credit Decisions: Lenders and creditors use ratios like the current ratio and debt-to-equity ratio to assess a company’s ability to repay loans.
- Operational Decisions: Managers can use ratios to analyze the company’s efficiency in operations, such as inventory turnover and asset utilization.
Limitations of Ratio Analysis
While ratio analysis provides valuable insights, it has some limitations:
- Dependence on Historical Data: Ratios are based on historical financial data, which may not reflect the current market conditions or future performance.
- Industry Comparisons: Ratios are often best interpreted when compared to industry averages. What might be considered a strong ratio in one industry could be average in another.
- Accounting Practices: Different companies may have different accounting practices that affect their financial statements, which could make direct comparisons misleading.
Conclusion
Ratio analysis is an essential tool for assessing a company’s financial health and making informed business decisions. By understanding liquidity, profitability, leverage, efficiency, and market ratios, stakeholders can evaluate a company’s performance from various angles. However, it’s important to consider the limitations of ratio analysis and use these ratios in conjunction with other tools and insights for a comprehensive analysis.
Understanding and utilizing ratio analysis can help companies optimize operations, secure financing, attract investors, and achieve long-term financial stability.
FAQs on Ratio Analysis
1. What is the most important ratio in ratio analysis?
While all ratios are important, the current ratio and return on equity (ROE) are often considered among the most significant as they indicate a company’s ability to meet its short-term obligations and generate profits for shareholders.
2. How often should ratio analysis be performed?
Ratio analysis should be performed regularly—typically quarterly or annually—to monitor changes in a company’s financial performance.
3. Can ratio analysis predict future performance?
Ratio analysis is based on historical data and cannot predict future performance. It can, however, highlight trends that may provide insights into potential future outcomes.
4. How do I compare a company’s ratios to industry averages?
You can obtain industry averages from financial publications, reports, or databases like Bloomberg, and compare the company’s ratios to these benchmarks.